Some time ago, I wrote about how Visio resolves fonts identified in the document by an ID with the collection of fonts that are actually installed on a user's system. In this post I wanted to look at the standard set of fonts that Visio maintains and why they're there.
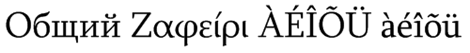
[The image above shows: English using Segoe UI (not a base font), Armenian using Sylfaen and Korean using Malgun Gothic]
Visio uses an ID to identify fonts in the document. The first 23 (1-based) represent what you can think of a standard or base set (not necessarily installed, but I'll come to that). In the older flat xml .vdx file format you could see this set listed in the file and in those days Visio used Arial as the default in line with the rest of Office. In Office 2007 the default changed to Calibri, although I can't remember whether Visio got this on exactly the same timeline. If you combine the old set (from an old .vdx document) with a set from a current version you should get the following result:
| Pre 2007 | Current (April 2024) | |
|---|---|---|
| 1 | MS Arial Unicode | MS Arial Unicode |
| 2 | Symbol | Symbol |
| 3 | Wingdings | Wingdings |
| 4 | Arial | Calibri |
| 5 | SimSun | SimSun |
| 6 | PMingLiU | PMingLiU |
| 7 | MS PGothic | MS PGothic |
| 8 | Dotum | Dotum |
| 9 | Sylfaen | Sylfaen |
| 10 | Estrangelo Edessa | Estrangelo Edessa |
| 11 | Vrinda | Vrinda |
| 12 | Shruti | Shruti |
| 13 | Mangal | Mangal |
| 14 | Tunga | Tunga |
| 15 | Sendnya | Sendnya |
| 16 | Raavi | Raavi |
| 17 | Dhenu | Dhenu |
| 18 | Latha | Latha |
| 19 | Gautami | Gautami |
| 20 | Cordia | New Cordia New |
| 21 | MS Farsi | Arial |
| 22 | Gulim | Malgun Gothic |
| 23 | Times New Roman | Times New Roman |
It's unlikely that all of these fonts will be installed on a single system. My own system, for example, has about nine. Windows and Office comes with a standard installed set of fonts (eg see Windows 11 font list). There are also a large number of optional font families that can be installed, but are not by default.
To understand the Visio set better, I think it helps to look at what each of these fonts represent and I've included a list below.
If you look through the list you can see that there's a spread of font fallback options for many of the language groups, from Simplified and Traditional Chinese to Telugu, Korean, Gujarati, Thai, Japanese.....you get the picture.
*[Note that Visio currently doesn't take part in the Cloud Fonts system which is a more recent technique that makes it easier for users to make use of a wider range of fonts.]
The Font List
The following is a list of the individual fonts that make up the base (1-23) fonts in Visio and all information is the main Font Library page at Microsoft Typography.
1 - Arial Unicode MS

Originally commissioned by Microsoft Office as an extended version of the Arial typeface to support a large set of international characters. The font was included with Office but not Windows. Over time the Unicode standard grew to the point where it was not possible to include all encoded characters in a single font file, so today most applications rely on font linking or font fallback to provide appropriate language support when a selected font doesn’t include the characters you need. We stopped servicing and updating Arial Unicode and no longer install it as part of Office.
https://learn.microsoft.com/en-us/typography/font-list/arial-unicode-ms
2 - Symbol

Contains Times New Roman Greek capitals and lowercase, figures and basic punctuation together with a collection of mathematical signs and general purpose Pi characters. Use for setting mathematical and scientific work and as a compliment to the symbols found in standard fonts.
https://learn.microsoft.com/en-us/typography/font-list/symbol
3 - Wingdings

Designed by Kris Holmes and Charles Bigelow in 1990 and 1991. The fonts were originally named Lucida Icons, Arrows, and Stars to complement the Lucida text font family by the same designers. Renamed, reorganized, and released in 1992 as Microsoft Wingdings(TM), the three fonts provide a harmoniously designed set of icons representing the common components of personal computer systems and the elements of graphical user interfaces.
https://learn.microsoft.com/en-us/typography/font-list/wingdings
4 - Calibri

A modern sans serif family with subtle roundings on stems and corners. It features real italics, small caps, and multiple numeral sets. Its proportions allow high impact in tightly set lines of big and small text alike.
https://learn.microsoft.com/en-us/typography/font-list/calibri
5 - SimSun
Simplified Chinese
SimSun & NSimSun is a Simplified Chinese font features mincho (serif) stroke style.
https://learn.microsoft.com/en-us/typography/font-list/simsun
6 - PMingLiU
Traditional Chinese

MingLiu font is a Traditional Chinese font in a mincho (serif) stroke style.
https://learn.microsoft.com/en-us/typography/font-list/mingliu
7 - MS PGothic
Japanese

A Japanese font with proportional latin in the gothic (sans serif) style
https://learn.microsoft.com/en-us/typography/font-list/ms-gothic
8 - Dotum
Korean
A Korean font.
https://learn.microsoft.com/en-us/typography/font-list/dotum
9 - Sylfaen
General wide range
Designed for Microsoft in 1998 by John Hudson and W. Ross Mills of Tiro Typeworks, and Geraldine Wade of Monotype Typography. Sylfaen is a Welsh word meaning "foundation"; an apt name since the font stemmed from research into the typographic requirements of many different scripts and languages. This version of Sylfaen supports the WGL4.0 character set, for Pan-European language coverage. In addition to Latin, Greek and Cyrillic letterforms, the font contains the characters necessary for support of the Armenian and Georgian languages.
https://learn.microsoft.com/en-us/typography/font-list/sylfaen
10 - Estrangelo Edessa
Syriac script
A Unicode encoded OpenType font file supporting the Syriac script. The font contains TrueType character outlines and has been optimized for display on screen at small sizes, within software user interface elements such as button descriptions and dialog box text. The Syriac letter forms were designed by Paul Nelson and George Kiraz. Some symbols, including numerical symbols are based on the monospaced Courier type design.
https://learn.microsoft.com/en-us/typography/font-list/estrangelo-edessa
11 - Vrinda
Bengali

An OpenType font for the Indic script - Bengali. It is based on Unicode, contains TrueType outlines and has been designed for use as a UI font.
https://learn.microsoft.com/en-us/typography/font-list/vrinda
12 - Shruti
Gujarati
An OpenType font for the Indic script - Gujarati. It is based on Unicode, contains TrueType outlines and has been designed for use as a UI font.
https://learn.microsoft.com/en-us/typography/font-list/shruti
13 - Mangal
Devanagari
An OpenType font for the Indic script - Devanagari. It is based on Unicode, contains TrueType outlines and has been designed for use as a UI font.
https://learn.microsoft.com/en-us/typography/font-list/mangal
14 - Tunga
Kannada

An OpenType font for the Indic script - Kannada. It is based on Unicode, contains TrueType outlines and has been designed for use as a UI font.
https://learn.microsoft.com/en-us/typography/font-list/tunga
15 - Sendnya
16 - Raavi
Panjabi
The Raavi font is a Windows font that is primarily intended to support the Panjabi language and any other languages written using the Gurmukhi script. It does support characters used in English and other western European languages, but nonetheless was created primarily to support Panjabi. The Latin characters in the Raavi font were actually adapted from the Microsoft Sans Serif font. If you want to use Raavi, please install the optional feature, "Gurmukhi Supplemental Fonts".
https://learn.microsoft.com/en-us/typography/font-list/raavi
17 - Dhenu
18 - Latha
Tamil

A font for the Indic script-Tamil. It has been designed for use as a UI font. It is an OpenType font, based on Unicode and contains TrueType outlines.
https://learn.microsoft.com/en-us/typography/font-list/latha
19 - Gautami
Telugu

An OpenType font for the Indic script-Telugu. It is based on Unicode, contains TrueType outlines and has been designed for use as a UI font.
https://learn.microsoft.com/en-us/typography/font-list/gautami
20 - Cordia New
Thai
A Thai font designed by Unity Progress and offered under license from Microsoft.
https://learn.microsoft.com/en-us/typography/font-list/cordia-new
21 - Arial
A contemporary sans serif design, Arial contains more humanist characteristics than many of its predecessors and as such is more in tune with the mood of the last decades of the twentieth century. The overall treatment of curves is softer and fuller than in most industrial style sans serif faces. Terminal strokes are cut on the diagonal which helps to give the face a less mechanical appearance. Arial is an extremely versatile family of typefaces which can be used with equal success for text setting in reports, presentations, magazines etc, and for display use in newspapers, advertising and promotions.
https://learn.microsoft.com/en-us/typography/font-list/arial
22 - Malgun Gothic
Korean

A Korean font developed by taking advantage of ClearType technology, and it provides excellent reading experience particularly onscreen. Its elements are created based on the typeface of Hunminjeongeum, and streamlined with modern form of characters as well as upright and well-regulated strokes. The font is very legible at small sizes with its moderate open counters, and its even inter-character spacing and visual center line maximize the readability.
https://learn.microsoft.com/en-us/typography/font-list/malgun-gothic
23 - Times New Roman

This remarkable typeface first appeared in 1932 in The Times of London newspaper, for which it was designed. It has subsequently become one of the worlds most successful type creations. The original drawings were made under Stanley Morison's direction by Victor Lardent at The Times. It then went through an extensive iterative process involving further work in Monotype's Type Drawing Office. Based on experiments Morison had conducted using Perpetua and Plantin, it has many old style characteristics but was adapted to give excellent legibility coupled with good economy. Widely used in books and magazines, for reports, office documents and also for display and advertising.
https://learn.microsoft.com/en-us/typography/font-list/times-new-roman